
Thanks to Harshal Shah for creating the framework from scratch and getting me to dig into this.
In this tutorial we are going to setup a complete stack which will collect performance metrics from multiple machines, store it in a datastore and visualise as graphs. Let’s go over the setup, design and role of individual components and then jump into configuring individual components and linking them together.
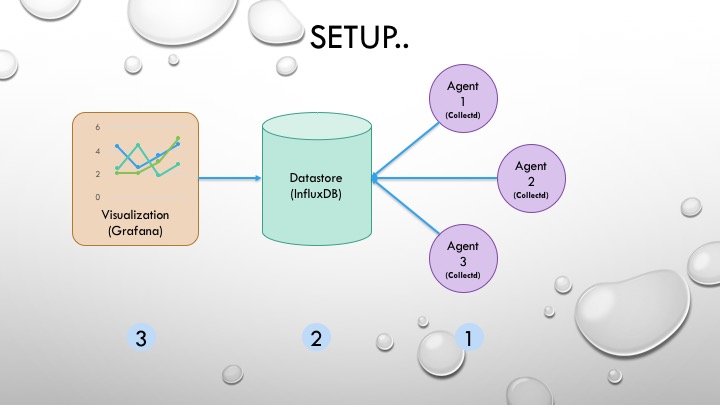
We have a three layer setup – and this setup is available as a setup of vagrant boxes with associated configuration scripts at github repo. We have three machines which are reporting performance metrics using CollectD. The data is stored on another host inside InfluxDB. And we are using Grafana to query data from InfluxDB and visualise it. InfluxDB and Grafana are on same Vagrant instance while CollectD daemon is running on their own vagrant instances.
Components
CollectD
CollectD is a performance monitoring daemon which can collect and store information. It is built in “C” which makes it performant and portable across devices. It has quite a few plugins which you can simply configure and start using. We will use a few plugins while implementing our use case.
InfluxDB
InfluxDB (Docs here) is a time series database – the kind of databases which are made for time series operations. Imaging collecting data from a machine every 10 seconds and then using various mathematical functions to chart and determine trends over time and functions such as min, max, median over X hours etc. Discussing time series database in detail deserves another post – but for the purpose of this tutorial we will store our time series data in influxDB. We are going to use a single node setup, but in practice there might be need for a cluster setup of InfluxDB.
Grafana
Grafana is a dashboarding tool for building visualisations on top of data. It works well with time series data. We will simply fetch data from InfluxDB and try to create a few dashboards. You can play around with Grafana in the sandbox here
Configuration
In this section we will walk through some of important configuration in configuration files. Of course we are not covering all possible and optimised configurations – but this is a good start if you want to tweak something.
CollectD
For CollectD we first define hostname and how frequently the measurements should be done on that machine:
Hostname "%HOSTNAME%"

Interval 5
ReadThreads 5
For measuring anything on system – we need to use plugins. For plugins there are two things you need to define – first load the needed plugin and secondly define appropriate settings for them. In following plugins there are default settings built in and simply loading them will start those measurements for us:
LoadPlugin cpu
LoadPlugin load
LoadPlugin memory
LoadPlugin swap
LoadPlugin battery
Finally we use network plugin to send this data to influxDB server by defining a hostname and port. Since we are adding IP address for this host in /etc/hosts file – it will resolve the name
InfluxDB
For InfluxDB there are quite a few configuration settings which we are using from template. There is only one section that we are touching – which is related to collectd. Apart from enabling the CollectD and database name and port, there is one more important setting. The “typesdb” defines a file which InfluxDB uses to interpret data from collectd. This file must be same as it is used by CollectD and any differences will create communication issues.
[collectd]
enabled = true
bind-address = ":25826"
database = "collectd"
…...
typesdb = "/usr/share/collectd/types.db"
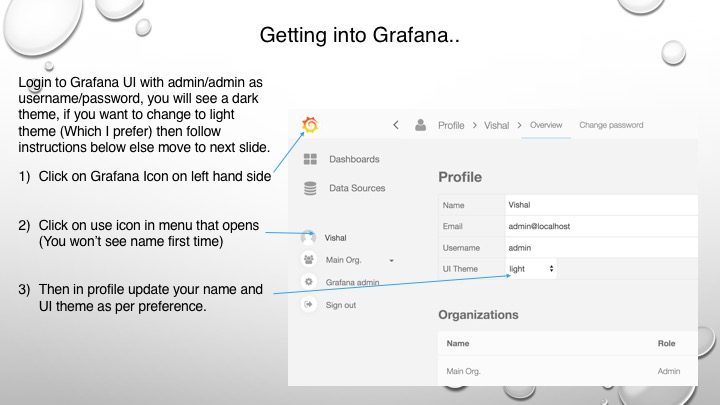
For Grafana we are not fiddling with the configuration file directly. We will configure a few things eventually via UI so we get a better understanding of things as well.
Running it all together
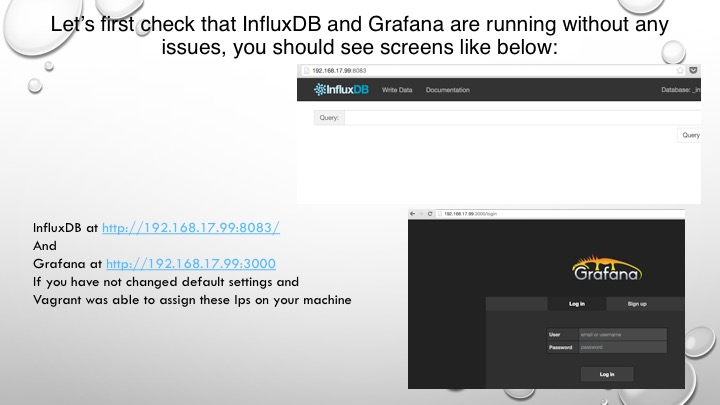
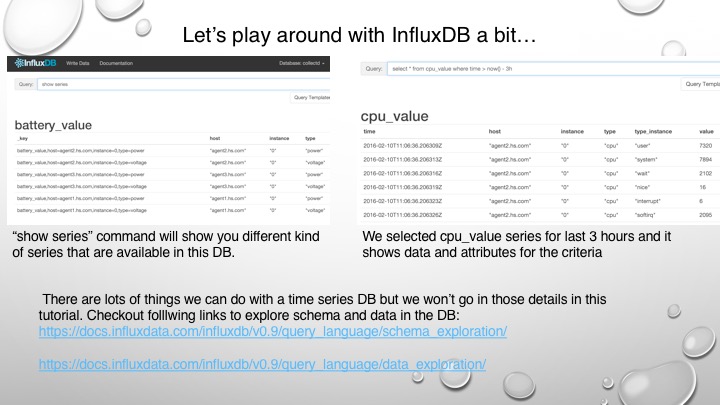
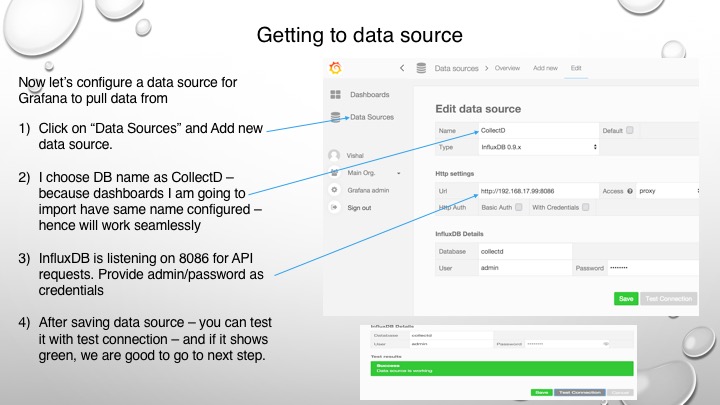
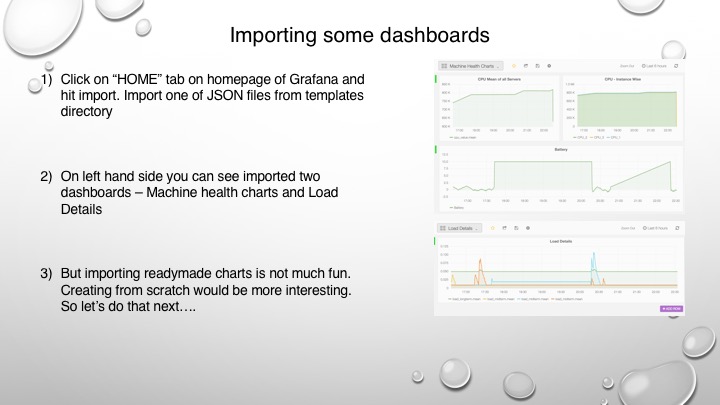
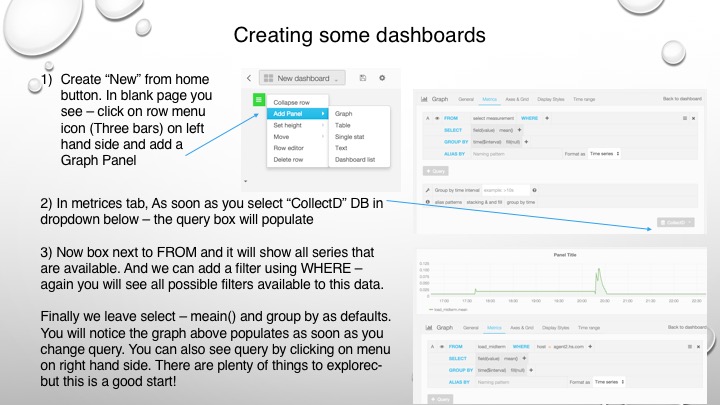
Assuming you have checked out the code and “vagrant up” was successful in getting all instances up and running, let’s try to configure and play around with setup. Follow the images:
Please comment if you see any issues in code: https://github.com/vishal-biyani/collectd-influxdb-grafana. Above images are also available as slides here: http://www.slideshare.net/vrbiyani/graphing-performance-with-collectd-influxdb-grafana